SystemTap 为 Linux 内核和用户态程序提供了动态跟踪功能。用户可以自定义探测事件来跟踪程序的运行情况,如函数调用栈、系统调用以及其他事件。SystemTap 可以在不修改代码、甚至是不需要重启的情况下就能分析程序的运行情况。
SystemTap 的基本思想是命名事件,以及事件对应的处理程序。当运行 SystemTap 脚本时,SystemTap 会监视事件;一旦事件发生,Linux 内核就会将处理程序作为子例程运行,然后继续运行。SystemTap 有几种事件:进入/退出函数、计时器到期、会话开始/终止等。处理程序是一系列脚本语句,指定事件发生时要执行的工作。这项工作包括从事件上下午中提取数据,将其存储到内部变量中,打印结果。
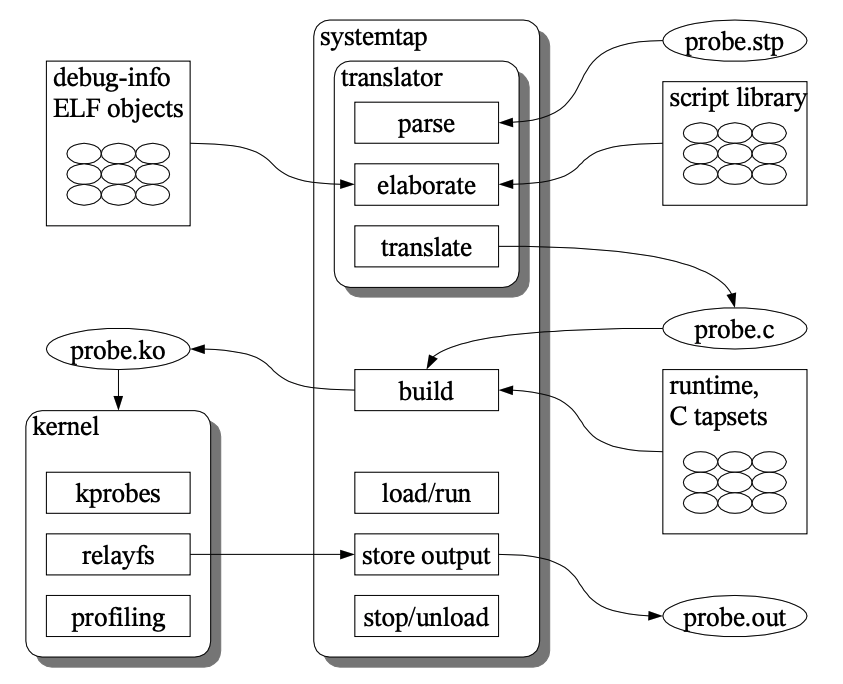
SystemTap 的工作原理是将 SystemTap 脚本翻译成 C 语言,然后将其编译为内核模块,并加载到内核中并启用脚本中的探测点;当相应的事件发生时,事件对应的处理程序被执行;一旦 SystemTap 会话结束,探测点将被禁用,内核模块也被卸载。下图是 SystemTap 的处理过程。
图片来源于 Architecture of systemtap: a Linux trace/probe tool 。
安装 本文的环境如下所示:
1
2
3
4
5
6
7
8
$ lsb_release -a No LSB modules are available. Distributor ID: Ubuntu Description: Ubuntu 20.04.5 LTS Release: 20.04 Codename: focal $ uname -r 5.4.0-135-generic
SystemTap 最初主要是针对内核的跟踪分析工具,但是在 SystemTap 0.6 版本的时候引入了用户态程序的跟踪分析。SystemTap 需要 uprobes 模块来执行用户态的探测,如果您的 Linux 内核版本是 3.5 及其之后的版本,那么该模块已经包含在内。您可以使用下面的命令来查看内核是否支持 uprobes:
1
2
$ grep CONFIG_UPROBES /boot/config-$(uname -r) CONFIG_UPROBES=y
上面的结构表示当前内核集成了 uprobes 模块。如果您运行的是 3.5 之前的内核,SystemTap 会自动构建 uprobes 模块,但是,您还需要 utrace 内核扩展,SystemTap 使用该扩展来跟踪用户态事件。有关 utrace 的更多详细信息,请参考这里 。您可以使用下面的命令来查看内核是否支持 utrace:
1
2
$ grep CONFIG_UTRACE /boot/config-$(uname -r) CONFIG_UTRACE=y
在使用 SystemTap 对 PostgreSQL 进行动态跟踪时,我们需要在编译 PostgreSQL 的时候指定 --enable-dtrace 选项,我们可以通过下面的命令在 Ubuntu 平台 SystemTap 。
1 $ sudo apt-get install -y systemtap systemtap-runtime systemtap-sdt-dev
我们可以使用下面的命令来验证 SystemTap 是否正确安装。
1 $ sudo stap -ve 'probe begin {printf("hello world\n"); exit();}'
如果上述命令运行之后出现类似如下输出,则说明 SystemTap 已经正确安装。
1
2
3
4
5
6
7
Pass 1: parsed user script and 476 library scripts using 104372virt/90904res/7368shr/83404data kb, in 270usr/40sys/307real ms. Pass 2: analyzed script: 1 probe, 1 function, 0 embeds, 0 globals using 105956virt/92788res/7688shr/84988data kb, in 10usr/0sys/11real ms. Pass 3: translated to C into "/tmp/stap7kdlzF/stap_2dbabdb328ff4c9621fa9f038ccc4a6d_992_src.c" using 105956virt/92788res/7688shr/84988data kb, in 0usr/0sys/0real ms. Pass 4: compiled C into "stap_2dbabdb328ff4c9621fa9f038ccc4a6d_992.ko" in 2830usr/900sys/3843real ms. Pass 5: starting run. hello world Pass 5: run completed in 10usr/30sys/479real ms.
测试 我们先通过一个小例子来熟悉一下 SystemTap 的使用。我们以斐波那契数列来作为演示。
1
2
3
4
5
6
7
8
9
10
11
12
13
14
15
16
17
18
19
20
21
22
23
24
$ cat fib.c int fib(int n) { if (n == 0 || n == 1) { return 1; } return fib(n-1) + fib(n-2); } int main(int argc, char **argv) { int n = atoi(argv[1]); printf ("fib(%d) = %d\n" , n, fib(n)); return 0; } $ gcc -g -o fib fib.c
接下来我们创建 SystemTap 脚本来捕获 fib 程序的调用栈。
1
2
3
4
5
6
7
8
$ cat fib.stp probe process("./fib" ).function ("*" ) { printf ("%s -> %s: %s\n" , thread_indent(3), ppfunc(), $$parms ); } probe process("./fib" ).function ("*" ).return { printf ("%s <- %s: %s\n" , thread_indent(-3), ppfunc(), $$return ); }
function() 是函数进入的位置。function().return 是函数返回的位置。thread_indent() 用于记录缩紧的长度。ppfunc() 返回函数的名称。$$parms 变量记录了调用该函数的参数。$$return 函数的返回值。
现在,我们在两个终端中分别执行 stap 和 fib 就可以捕获到 fib 的调用栈。
1
2
3
4
5
$ $ sudo stap fib.stp WARNING: function _start return probe is blacklisted: keyword at fib.stp:13:1 source : probe process("./fib" ).function ("*" ).return { ^
终端一执行完上述命令之后会一直处于等待状态,接着我们在终端二中执行下面的命令。
终端二执行完成之后,我们可以在终端一中看到如下输出。
1 2 3 4 5 6 7 8 9 10 11 12 13 14 15 16 17 18 19 20 21 22 23 24 25 26 27 28 29 30 31 32 33 34 35 36 37 38 39 40 41 42 43 44 45 46 47 0 fib(814956): -> _start: 21 fib(814956): -> __libc_csu_init: 26 fib(814956): -> _init: 30 fib(814956): <- _init: 33 fib(814956): -> frame_dummy: 37 fib(814956): -> register_tm_clones: 41 fib(814956): <- register_tm_clones: 42 fib(814956): <- frame_dummy: 45 fib(814956): <- __libc_csu_init: 50 fib(814956): -> main: argc=0x2 argv=0x7ffd055f6208 62 fib(814956): -> fib: n=0x5 68 fib(814956): -> fib: n=0x4 74 fib(814956): -> fib: n=0x3 80 fib(814956): -> fib: n=0x2 86 fib(814956): -> fib: n=0x1 90 fib(814956): <- fib: return =0x1 95 fib(814956): -> fib: n=0x0 99 fib(814956): <- fib: return =0x1 101 fib(814956): <- fib: return =0x2 106 fib(814956): -> fib: n=0x1 110 fib(814956): <- fib: return =0x1 112 fib(814956): <- fib: return =0x3 116 fib(814956): -> fib: n=0x2 122 fib(814956): -> fib: n=0x1 126 fib(814956): <- fib: return =0x1 130 fib(814956): -> fib: n=0x0 134 fib(814956): <- fib: return =0x1 136 fib(814956): <- fib: return =0x2 138 fib(814956): <- fib: return =0x5 143 fib(814956): -> fib: n=0x3 148 fib(814956): -> fib: n=0x2 154 fib(814956): -> fib: n=0x1 158 fib(814956): <- fib: return =0x1 162 fib(814956): -> fib: n=0x0 165 fib(814956): <- fib: return =0x1 168 fib(814956): <- fib: return =0x2 172 fib(814956): -> fib: n=0x1 176 fib(814956): <- fib: return =0x1 178 fib(814956): <- fib: return =0x3 180 fib(814956): <- fib: return =0x8 279 fib(814956): <- main: return =0x0 284 fib(814956): -> __do_global_dtors_aux: 290 fib(814956): -> deregister_tm_clones: 293 fib(814956): <- deregister_tm_clones: 296 fib(814956): <- __do_global_dtors_aux: 298 fib(814956): -> _fini: 301 fib(814956): <- _fini:
SystemTap 脚本 在上面的示例中我们已经见到了如何使用 SystemTap 脚本,大多少情况下,SystemTap 脚本是每个 SystemTap 会话的基础,它指示了 SystemTap 应该收集什么类型的信息以及对收集的信息做什么处理。本节我们将简要介绍一下 SystemTap 脚本的基本语法。
基本语法 SystemTap 脚本由两个组件构成:事件(events)和处理程序(handlers)。一旦 SystemTap 会话开始,SystemTap 将监视操作系统中指定的事件并在事件发生时执行处理程序。事件和对应的处理程序统称为探测点(probe)。SystemTap 脚本通常使用 .stp 后缀,并包含如下格式的探测点:
1 probe event {statements}
SystemTap 同一探测点支持多个事件,多个事件通过逗号(,)分割,如果在一个探测点指定了多个事件,任何一个事件发生都将执行处理程序。我们还可以在 SystemTap 脚本中定义函数,如下所示:
1
2
function func_name(arguments) {statements} probe event {func_name(arguments)}
事件 SystemTap 事件大致可以分为两种类型:同步(synchronous)和异步(asynchronous)。
当任何进程在内核代码的特定位置执行指令时,就会发生同步事件。这为其他事件提供了一个参考点,从中可以获得更多的上下文数据。同步事件包含以下示例:
syscall.system_call - 系统调用 system_call 的开始,可以在其后面添加 .return 后缀监控系统调用退出。例如想要监控系统调用 close 函数的开始和退出,可以使用 syscall.close 和 syscall.close.return。
vfs.file_operation - 虚拟文件系统(VFS)的 file_operation 的开始。与 syscall 类型,可以添加 .return 后缀监控 file_operation 的退出。
kernel.function("function") - 内核函数 function 的开始。例如 kernel.function("sys_open") 指的是内核函数 sys_open 被系统任意线程调用时发生的事件,同样地,可以通过 .return 后缀指定 sys_open 退出事件,即 kernel.function("sys_open").return。
当定义探测事件时,我们可以使用星号(*)通配符。此外,我们还可以跟踪内核源文件中的函数开始和退出,如下所示:
1
2
probe kernel.function("*@net/socket.c" ) {} probe kernel.function("*@net/socket.c" ).return {}
kernel.trace("tracepoint") - tracepoint 的静态探测点。最近的内核(2.6.30 和更新版本)包括对内核中特定事件的检测。这些事件用跟踪点静态标记。SystemTap 中可用的跟踪点的一个示例是 kernel.trace("kfree_skb"),它指示每次在内核中释放网络缓冲区。
module("module").function("function") - 探测特定模块下的 function 函数,例如:
1
2
probe module("ext3" ).function("*" ) {} probe module("ext3" ).function("*" ).return {}
异步事件与代码中的特定指令或位置无关。这一系列探测点主要由计数器、计时器和类似结构组成。异步事件包含以下示例:
begin, end - 分别表示 SystemTap 会话的开始和结束。timer events - 指定要定期执行的处理程序的事件。例如: 1 2 3 probe timer.s(4 ) { printf("hello world\n" ); }
hello world,我们还可以使用下面的定时器事件:
timer.ms(milliseconds)timer.us(microseconds)timer.ns(nanoseconds)timer.hz(hertz)timer.jiffies(jiffies)
处理程序 SystemTap 支持在处理程序中使用几个基本结构。大多数这些处理程序构造的语法主要基于 C 和 awk 语法。本节描述几个最有用的 SystemTap 处理程序构造,它们应该为您提供足够的信息来编写简单但有用的 SystemTap 脚本。
变量 我们可以在 SystemTap 脚本中自由的使用变量,SystemTap 将自动推导变量的类型,例如 foo = gettimeofday_s(),foo 的类型为整型,在 printf() 函数中可以使用 %d 来格式化输出。默认情况下,变量都是某个探测点的局部变量,如果想要在多个探测点共享变量,那么可以在探测点之外使用 global 关键字修饰变量,例如:
1 2 3 4 5 6 7 8 global count_jiffies, count_ms probe timer.jiffies(100 ) { count_jiffies++ } probe timer.ms(100 ) { count_ms++ } probe timer.ms(12345 ) { hz = (1000 * count_jiffies) / count_ms printf("jiffies:ms ratio %d:%d => CONFIG_HZ=%d\n" , count_jiffies, count_ms, hz) exit() }
上面的示例使用 jiffies 和 ms 计时器计算内核的 CONFIG_HZ 设置,然后进行相应的计算。global 语句允许脚本在探测点之间共享 count_jiffies 和 count_ms(在它们各自的探测点中设置)变量。
目标变量 我们可以使用 -L 选项来列出探测点可用的目标变量,如果为正在运行的内核安装了调试信息,则可以运行以下命令找出哪些目标变量可用于 vfs_read 函数:
1 2 $ stap -L 'kernel.function("vfs_read")' kernel.function("vfs_read@fs/read_write.c:277" ) $file :struct file* $buf :char* $count :size_t $pos :loff_t*
每个目标变量前面都有一个 $ 符号,目标变量的类型在 : 之后。内核 vfs_read 函数入口处的目标变量有 $file(指向描述文件的结构指针)、$buf(指向用于存储读取数据的用户空间内存的指针)、$count(要读取的字节数)和 $pos(从文件中读取开始位置)。
如果目标变量不是探测点的局部变量,如果外部全局变量或者文件局部静态变量,我们可以使用 @var("varname@src/file.c") 来引用;我们还可以使用形如 @var("varname", "/path/to/exe/or/lib") 来引入可执行文件或库中的变量。
如果是执行基础类型的指针(如整型、字符串等),我们可以使用下面的函数来获取内核空间数据。
kernel_char(address) - 从内核内存中获取 address 处的字符。kernel_short(address) - 从内核内存中获取 address 处的 short 类型数据。kernel_int(address) - 从内核内存中获取 address 处的 int 类型数据。kernel_long(address) - 从内核内存中获取 address 处的 long 类型数据。kernel_string(address) - 从内核内存中获取 address 处的字符串。kernel_string(address) - 从内核内存中获取 address 处的长度为 n 的字符串。
同样地,SystemTap 提供了一系列函数用于获取用户空间数据。
user_char(address) - 从用户内存中获取 address 处的字符。user_short(address) - 从用户内存中获取 address 处的 short 类型数据。user_int(address) - 从用户内存中获取 address 处的 int 类型数据。user_long(address) - 从用户内存中获取 address 处的 long 类型数据。user_string(address) - 从用户内存中获取 address 处的字符串。user_string(address) - 从用户内存中获取 address 处的长度为 n 的字符串。
为了方便 SystemTap 提供了一系列内置变量用于打印目标变量。
$$vars - 等同于 sprintf("parm1=%x ... parmN=%x var1=%x ... varN=%x", parm1, ..., parmN, var1, ... varN),有些变量由于无法找到运行时位置可能被输出为 =?。$$locals - $$vars 的子集,仅包含局部变量。$$parms - $$vars 的子集,仅包含函数参数。$$return - 仅在 .return 中有效,如果函数有返回值,等同于 sprintf("return=%x", $return);否则为空字符串。
我们可以在变量后面添加 $ 或 $$ 后缀对变量进行展开,例如:
1 2 3 4 5 $ sudo stap -e 'probe kernel.function("vfs_read") {printf("%s\n", $$parms$); exit(); }' file={.f_u={...}, .f_path={...}, .f_op=0xffffffffa06e1d80, .f_lock={...}, .f_count={...}, .f_flags=34818, .f_mode=31, .f_pos=0, .f_owner={...}, .f_cred=0xffff88013148fc80, .f_ra={...}, .f_version=0, .f_security=0xffff8800b8dce560, .private_data=0x0, .f_ep_links={...}, .f_mapping=0xffff880037f8fdf8} buf="" count=8196 pos=-131938753921208 $ sudo stap -e 'probe kernel.function("vfs_read") {printf("%s\n", $$parms$$); exit(); }' file={.f_u={.fu_list={.next=0xffff8801336ca0e8, .prev=0xffff88012ded0840}, .fu_rcuhead={.next=0xffff8801336ca0e8, .func=0xffff88012ded0840}}, .f_path={.mnt=0xffff880132fc97c0, .dentry=0xffff88001a889cc0}, .f_op=0xffffffffa06f64c0, .f_lock={.raw_lock={.slock=196611}}, .f_count={.counter=2}, .f_flags=34818, .f_mode=31, .f_pos=0, .f_owner={.lock={.raw_lock={.lock=16777216}}, .pid=0x0, .pid_type=0, .uid=0, .euid=0, .signum=0}, .f_cred=0xffff880130129a80, .f_ra={.start=0, .size=0, .async_size=0, .ra_pages=32, ...
控制语句 在某些情况下,SystemTap 脚本的输出可能非常大。要解决这个问题,我们需要进一步细化脚本的逻辑,以便将输出的内容与我们的探测更相关。通过在处理程序中使用条件语句来做到这一点。SystemTap 支持以下类型的控制语句:
if/else 语句1 2 3 4 if (condition) statement1 else statement2
while 循环语句1 2 while (condition) statement
for 循环语句1 2 for (initialization; condition; increment) statement
关联数组 SystemTap 支持关联数组(Associative Array),不管关联数组是在一个探测点还是多个探测点使用,我们都必须将其定义为全局变量,即使用 global 定义在所有探测点之外。关联数组最多支持 9 个下标,使用逗号分隔开,如下所示:
1 device[pid(), execname(), uid(), ppid(), "W" ] = devname
我们可以使用 = 对关联数据进行赋值,如 array_name[index_expression] = value。通过 array_name[index_expression] 可以从关联数组中取出值。关联数组的遍历可以使用 foreach,例如:。
1 2 foreach(count in reads) printf("%s: %d\n" , count, reads[count])
我们可以在遍历的使用指定是升序(+)还是降序(-),同时,我们还可以指定遍历的数量(limit),如下所示:
1 2 foreach(count in reads- limit 10 ) printf("%s: %d\n" , count, reads[count])
delete 可以用于清除关联数组中的数据,如 delete reads。如果我们需要判断一个元素是否在关联数组中,可以 if ([index_expression] in array_name) statement 来进行判断。
聚合功能 SystemTap 还有一个聚合的功能(<<< value 操作符),例如:
1 2 3 4 global reads probe vfs.read { reads[execname()] <<< $count; }
与 = 不同的是,<<< 不会覆盖 reads[execname()] 的值,而是会将其视为一个唯一键值存储起来,后续我们可以使用 sum、max 等对其进行聚合运算,例如:
1
2
3
4
5
6
7
8
global reads probe vfs.read { reads[execname(), pid()] <<< $count; } probe timer.s(3 ) { foreach([var1, var2] in reads) printf("%s (%d): %d \n" , var1, var2, @count(reads[var1, var2])) }
SystemTap 支持以下聚合运算:
count - 返回存储在变量/数组索引表达式中的所有值的数量。sum - 返回存储在变量/数组索引表达式中的所有值的总和。min - 返回存储在变量/数组索引表达式中的所有值中的最小值。max - 返回存储在变量/数组索引表达式中的所有值中的最大值。avg - 返回存储在变量/数组索引表达式中的所有值中的平均值。
SystemTap 跟踪 PostgreSQL 本节将介绍如何使用 SystemTap 来跟踪 PostgreSQL。
查看探测点 首先,我们使用 stap 命令来获取 PostgreSQL 中所有的探测点。
1 2 3 4 5 6 7 8 9 10 11 12 13 $ stap -l 'process("postgres").function("*")' process("/home/japin/Codes/postgresql/Debug/pg/bin/postgres" ).function ("ATAddCheckConstraint@/home/japin/Codes/postgresql/Debug/../src/backend/commands/tablecmds.c:8840" ) process("/home/japin/Codes/postgresql/Debug/pg/bin/postgres" ).function ("ATAddForeignKeyConstraint@/home/japin/Codes/postgresql/Debug/../src/backend/commands/tablecmds.c:8977" ) process("/home/japin/Codes/postgresql/Debug/pg/bin/postgres" ).function ("ATCheckPartitionsNotInUse@/home/japin/Codes/postgresql/Debug/../src/backend/commands/tablecmds.c:6335" ) process("/home/japin/Codes/postgresql/Debug/pg/bin/postgres" ).function ("ATColumnChangeRequiresRewrite@/home/japin/Codes/postgresql/Debug/../src/backend/commands/tablecmds.c:12346" ) process("/home/japin/Codes/postgresql/Debug/pg/bin/postgres" ).function ("ATController@/home/japin/Codes/postgresql/Debug/../src/backend/commands/tablecmds.c:4435" ) process("/home/japin/Codes/postgresql/Debug/pg/bin/postgres" ).function ("ATDetachCheckNoForeignKeyRefs@/home/japin/Codes/postgresql/Debug/../src/backend/commands/tablecmds.c:19184" ) process("/home/japin/Codes/postgresql/Debug/pg/bin/postgres" ).function ("ATExecAddColumn@/home/japin/Codes/postgresql/Debug/../src/backend/commands/tablecmds.c:6644" ) process("/home/japin/Codes/postgresql/Debug/pg/bin/postgres" ).function ("ATExecAddConstraint@/home/japin/Codes/postgresql/Debug/../src/backend/commands/tablecmds.c:8725" ) process("/home/japin/Codes/postgresql/Debug/pg/bin/postgres" ).function ("ATExecAddIdentity@/home/japin/Codes/postgresql/Debug/../src/backend/commands/tablecmds.c:7645" ) process("/home/japin/Codes/postgresql/Debug/pg/bin/postgres" ).function ("ATExecAddIndex@/home/japin/Codes/postgresql/Debug/../src/backend/commands/tablecmds.c:8550" ) process("/home/japin/Codes/postgresql/Debug/pg/bin/postgres" ).function ("ATExecAddIndexConstraint@/home/japin/Codes/postgresql/Debug/../src/backend/commands/tablecmds.c:8633" ) [...]
此外,使用 -L 选项除了可以列出所有探测点,还可以列出局部变量。
1 2 3 4 5 6 7 8 9 10 11 12 13 $ stap -L 'process("postgres").function("*")' process("/home/japin/Codes/postgresql/Debug/pg/bin/postgres" ).function ("ATAddCheckConstraint@/home/japin/Codes/postgresql/Debug/../src/backend/commands/tablecmds.c:8840" ) $wqueue :List** $tab :AlteredTableInfo* $rel :Relation $constr :Constraint* $recurse :_Bool $recursing :_Bool $is_readd :_Bool $lockmode :LOCKMODE $newcons :List* $lcon :ListCell* $children :List* $child :ListCell* $address :ObjectAddress $__func__ :char const[] const process("/home/japin/Codes/postgresql/Debug/pg/bin/postgres" ).function ("ATAddForeignKeyConstraint@/home/japin/Codes/postgresql/Debug/../src/backend/commands/tablecmds.c:8977" ) $wqueue :List** $tab :AlteredTableInfo* $rel :Relation $fkconstraint :Constraint* $recurse :_Bool $recursing :_Bool $lockmode :LOCKMODE $pkrel :Relation $pkattnum :int16[] $fkattnum :int16[] $pktypoid :Oid[] $fktypoid :Oid[] $opclasses :Oid[] $pfeqoperators :Oid[] $ppeqoperators :Oid[] $ffeqoperators :Oid[] $fkdelsetcols :int16[] $i :int $numfks :int $numpks :int $numfkdelsetcols :int $indexOid :Oid $old_check_ok :_Bool $address :ObjectAddress $old_pfeqop_item :ListCell* $__func__ :char const[] const process("/home/japin/Codes/postgresql/Debug/pg/bin/postgres" ).function ("ATCheckPartitionsNotInUse@/home/japin/Codes/postgresql/Debug/../src/backend/commands/tablecmds.c:6335" ) $rel :Relation $lockmode :LOCKMODE process("/home/japin/Codes/postgresql/Debug/pg/bin/postgres" ).function ("ATColumnChangeRequiresRewrite@/home/japin/Codes/postgresql/Debug/../src/backend/commands/tablecmds.c:12346" ) $expr :Node* $varattno :AttrNumber process("/home/japin/Codes/postgresql/Debug/pg/bin/postgres" ).function ("ATController@/home/japin/Codes/postgresql/Debug/../src/backend/commands/tablecmds.c:4435" ) $parsetree :AlterTableStmt* $rel :Relation $cmds :List* $recurse :_Bool $lockmode :LOCKMODE $context :AlterTableUtilityContext* $wqueue :List* $lcmd :ListCell* process("/home/japin/Codes/postgresql/Debug/pg/bin/postgres" ).function ("ATDetachCheckNoForeignKeyRefs@/home/japin/Codes/postgresql/Debug/../src/backend/commands/tablecmds.c:19184" ) $partition :Relation $constraints :List* $cell :ListCell* $__func__ :char const[] const process("/home/japin/Codes/postgresql/Debug/pg/bin/postgres" ).function ("ATExecAddColumn@/home/japin/Codes/postgresql/Debug/../src/backend/commands/tablecmds.c:6644" ) $wqueue :List** $tab :AlteredTableInfo* $rel :Relation $cmd :AlterTableCmd** $recurse :_Bool $recursing :_Bool $lockmode :LOCKMODE $cur_pass :int $context :AlterTableUtilityContext* $myrelid :Oid $colDef :ColumnDef* $if_not_exists :_Bool $pgclass :Relation $attrdesc :Relation $reltup :HeapTuple $attribute :FormData_pg_attribute $newattnum :int $relkind :char $typeTuple :HeapTuple $typeOid :Oid $typmod :int32 $collOid :Oid $tform :Form_pg_type $defval :Expr* $children :List* $child :ListCell* $childcmd :AlterTableCmd* $aclresult :AclResult $address :ObjectAddress $tupdesc :TupleDesc $aattr :FormData_pg_attribute*[] $__func__ :char const[] const process("/home/japin/Codes/postgresql/Debug/pg/bin/postgres" ).function ("ATExecAddConstraint@/home/japin/Codes/postgresql/Debug/../src/backend/commands/tablecmds.c:8725" ) $wqueue :List** $tab :AlteredTableInfo* $rel :Relation $newConstraint :Constraint* $recurse :_Bool $is_readd :_Bool $lockmode :LOCKMODE $address :ObjectAddress $__func__ :char const[] const process("/home/japin/Codes/postgresql/Debug/pg/bin/postgres" ).function ("ATExecAddIdentity@/home/japin/Codes/postgresql/Debug/../src/backend/commands/tablecmds.c:7645" ) $rel :Relation $colName :char const* $def :Node* $lockmode :LOCKMODE $attrelation :Relation $tuple :HeapTuple $attTup :Form_pg_attribute $attnum :AttrNumber $address :ObjectAddress $cdef :ColumnDef* $__func__ :char const[] const process("/home/japin/Codes/postgresql/Debug/pg/bin/postgres" ).function ("ATExecAddIndex@/home/japin/Codes/postgresql/Debug/../src/backend/commands/tablecmds.c:8550" ) $tab :AlteredTableInfo* $rel :Relation $stmt :IndexStmt* $is_rebuild :_Bool $lockmode :LOCKMODE $check_rights :_Bool $skip_build :_Bool $quiet :_Bool $address :ObjectAddress process("/home/japin/Codes/postgresql/Debug/pg/bin/postgres" ).function ("ATExecAddIndexConstraint@/home/japin/Codes/postgresql/Debug/../src/backend/commands/tablecmds.c:8633" ) $tab :AlteredTableInfo* $rel :Relation $stmt :IndexStmt* $lockmode :LOCKMODE $index_oid :Oid $indexRel :Relation $indexName :char* $indexInfo :IndexInfo* $constraintName :char* $constraintType :char $address :ObjectAddress $flags :bits16 $__func__ :char const[] const [...]
从上面的输出可以看到,所有的探测点都以 process 开始,这是 SystemTap 跟踪用户态程序的统一使用方法。
查看调用栈 我们在前面使用 SystemTap 抓取了斐波那契数列的调用栈,同样地,我们在这里也从抓取 PostgreSQL 的调用栈开始。
1 2 3 4 5 6 7 8 9 10 11 12 13 14 15 16 17 18 19 20 21 22 23 24 25 26 27 28 29 30 31 32 33 34 35 36 37 38 39 40 41 42 43 44 45 $ cat call-stack.stp probe process.function("*" ) { printf ("%s -> %s\n" , thread_indent(3), ppfunc()); } probe process.function("*" ).return { thread_indent(-3); } $ sudo stap -x 493044 -o call-stack.log $ $ cat call-stack.log 0 postgres(493044): -> WaitEventSetWaitBlock 0 postgres(493044): -> pgstat_report_wait_end 0 postgres(493044): -> secure_raw_read 0 postgres(493044): -> ProcessClientReadInterrupt 0 postgres(493044): -> pq_getmessage 11 postgres(493044): -> resetStringInfo 20 postgres(493044): -> pq_getbytes 30 postgres(493044): -> enlargeStringInfo 38 postgres(493044): -> pq_getbytes 0 postgres(493044): -> SetCurrentStatementStartTimestamp 11 postgres(493044): -> GetCurrentTimestamp 0 postgres(493044): -> pq_getmsgstring 10 postgres(493044): -> pg_client_to_server 17 postgres(493044): -> pg_any_to_server 25 postgres(493044): -> pg_verify_mbstr 33 postgres(493044): -> pg_utf8_verifystr 0 postgres(493044): -> pq_getmsgend 0 postgres(493044): -> exec_simple_query 10 postgres(493044): -> pgstat_report_activity 18 postgres(493044): -> GetCurrentStatementStartTimestamp 27 postgres(493044): -> GetCurrentTimestamp 39 postgres(493044): -> start_xact_command 46 postgres(493044): -> StartTransactionCommand 54 postgres(493044): -> StartTransaction 60 postgres(493044): -> FullTransactionIdFromEpochAndXid 72 postgres(493044): -> GetUserIdAndSecContext 82 postgres(493044): -> RecoveryInProgress 91 postgres(493044): -> AtStart_Memory 101 postgres(493044): -> AllocSetContextCreateInternal 111 postgres(493044): -> MemoryContextCreate 121 postgres(493044): -> MemoryContextSwitchTo 131 postgres(493044): -> AtStart_ResourceOwner 140 postgres(493044): -> ResourceOwnerCreate [...]
SystemTap 抓取慢查询 在生产环境,我们可以会遇到慢查询的情况,我们同样可以使用 SystemTap 来分析 PostgreSQL 中的慢查询,脚本如下所示 :
1 2 3 4 5 6 7 8 9 10 11 12 13 14 15 16 17 18 19 20 21 22 23 24 25 26 $ cat pg_slow_query.stp global query_time, query_summary, threshold=0 probe begin { threshold = $1 ; } probe process.mark("query__start" ) { query_time[tid(), $arg1 ] = gettimeofday_s(); } probe process.mark("query__done" ) { p = tid(); t = query_time[p, $arg1 ]; delete query_time[p, $arg1 ]; if (t) { e = (gettimeofday_s() - t); if (e >= threshold) query_summary[p, user_string($arg1 )] <<< e; } } probe end { printf("%10s %10s %s\n", "tid", "time", "query"); foreach ([p, s] in query_summary) { printf("%10d %10d %s\n", p, @max(query_summary[p, s]), s); } }
query__start 和 query__done 是 PostgreSQL 预定义的探测点,参考 PostgreSQL 文档的动态跟踪 。注意:文档中使用的是 -,在 SystemTap 脚本中需要将其替换为 __。 begin 表示 SystemTap 会话开始的时候,end 则表示会话结束的时候。global 用于定义全局变量。
运行的时候需要指定慢查询的时间,如下所示:
1 2 3 $ sudo stap -x 493044 -T 60 pg_slow_query.stp 10 tid time query 493044 14 select random(), pg_sleep(14);
上面的命令将持续监控 493044 进程 60 秒并输出事务运行大于 10 秒的查询。
SystemTap 抓取事务信息 下面的脚本可以用于跟踪一段时间内事务的提交、回滚数量。
1 2 3 4 5 6 7 8 9 10 11 12 13 14 15 16 17 18 19 20 21 22 23 24 25 global start, abort, commit, ts probe begin { ts = gettimeofday_s(); } probe process.mark("transaction__start" ) { start++; } probe process.mark("transaction__abort" ) { abort++; } probe process.mark("transaction__commit" ) { commit++; } probe end { printf("\n" ); printf("Start %d\n" , start); printf("Abort %d\n" , abort); printf("Commit %d\n" , commit); printf("Total time (s) %d\n" , gettimeofday_s() - ts); }
当执行之后,其输出如下所示:
1 2 3 4 5 6 $ sudo stap -x 493044 txn_count.stp ^C Start 3 Abort 1 Commit 2 Total time (s) 11
参考 [1] https://sourceware.org/systemtap/SystemTap_Beginners_Guide.pdf https://sourceware.org/systemtap/archpaper.pdf https://sourceware.org/systemtap/tapsets/ https://www.postgresql.org/docs/current/dynamic-trace.html
笑林广记 - 讳聋哑
聋、哑二人各欲自讳。